Build your first data science web app using Streamlit - MLSA USM

Hello World, I'm Shaun Liew, Computer Sciences Student from Universiti Sains Malaysia. I'm also Beta Level Microsoft Learn Student Ambassador.
This article is for the "Build your first data science web app using Streamlit" workshop MLSA USM.
In this hands-on workshop, we'll show you how to create a machine learning web app using Streamlit. First, we'll create a classification model for Titanic survival prediction using logistic regression. Then, we'll dive into Streamlit and learn how to build an interactive web app that can leverage this machine-learning model. By the end of the workshop, you'll have a fully functional web app that can predict titanic survival.
Thank you very much for registering this workshop. Here’s some guidelines for you to have a better experience for this workshop.
Please follow the software installation setup guideline before the workshop starts.
We also included the step-by-step walkthrough for the workshop so that you can refer it anytime if you lost during the workshop.
This workshop consists of 2 parts.
Part 1: train your own logistic regression model using titanic kaggle dataset.
Part 2: use the trained ML model to make titanic prediction web app using Streamlit.
Before we start the workshop, make sure that you have gone through the installation guide from my Github repo.
Part 1 - Setup the project repo
open your visual studio code and open terminal using ctrl + shift + `
clone the github repo using git clone
git clone https://github.com/shaunliew/MLSA_Data_Science_Web_App_Streamlit.git
After the project is cloned, you need to activate the virtual environment for python project.
A virtual environment allows you to create an isolated environment specifically for your project, which ensures that any dependencies or packages that you install won't conflict with other projects or the global Python installation on your system.
python3.10 -m venv venv
for the code above, we are creating a virtual environment specifically for python version 3.10 and naming the environment package as venv.
Next, you need to activate the virtual environment.
For this project, I'm assuming you are creating this project from your D: drive. You need to change the directory according to where you store the project repo.
For windows,
./venv/Scripts/Activate.ps1
For mac,
source venv/bin/activate
After you run the command above, now your terminal should be look like this.

Now you need to install all the packages for this project into this virtual environment.
pip install -r requirements.txt
Congratulations , now you are good to start to build your machine learning model.
Part 2 - Build your machine learning model
Import the dataset and understand the dataset
The goal for this part is to build the classification model for titanic survival prediction and pickle the model so that we can use it in the Streamlit web app.
now go to model_training.ipynb to build the machine learning model.
Import all the libraries for the model training.
import numpy as np
import matplotlib.pyplot as plt
import pandas as pd
from sklearn.linear_model import LogisticRegression
from sklearn.preprocessing import StandardScaler
Now import all the dataset
train_dataset = pd.read_csv("titanic/train.csv")
test_dataset = pd.read_csv("titanic/test.csv")
test_labels = pd.read_csv("titanic/gender_submission.csv")
Notes: test_labels is needed for the model validation.
Check the features of the dataset.
print("train dataset info\n")
train_dataset.info()
Check the data distribution for both train and test dataset
print(train_dataset.describe())
print(test_dataset.describe())
Check the null values for both dataset
print(f"the null values in the train dataset are \n{train_dataset.isnull().sum()}\n")
print(f"the null values in the test dataset are \n{test_dataset.isnull().sum()}")
Below is the output for the null values checking
the null values in the train dataset are
PassengerId      0
Survived         0
Pclass           0
Name             0
Sex              0
Age            177
SibSp            0
Parch            0
Ticket           0
Fare             0
Cabin          687
Embarked         2
dtype: int64

the null values in the test dataset are
PassengerId      0
Pclass           0
Name             0
Sex              0
Age             86
SibSp            0
Parch            0
Ticket           0
Fare             1
Cabin          327
Embarked         0
dtype: int64
Feature Engineering
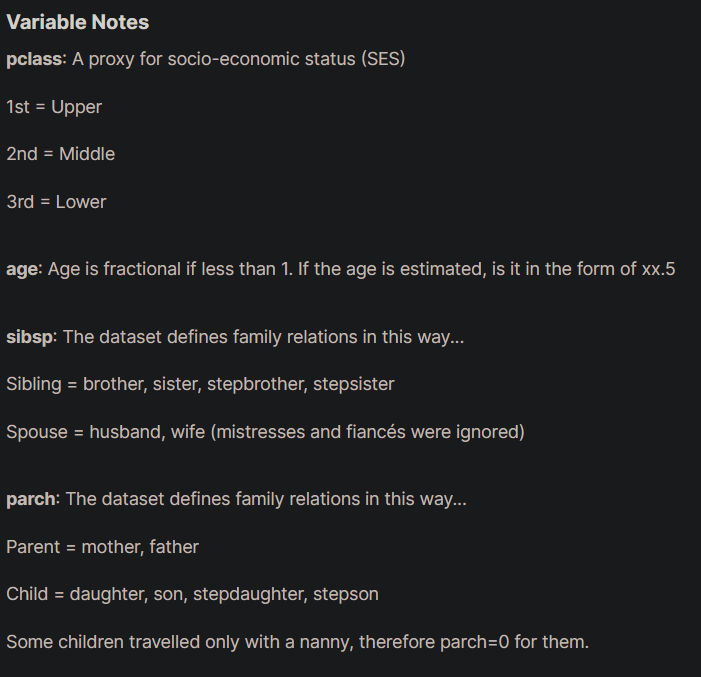
To further understand the dataset, the data dictionary and the explanation are given in the kaggle website. These are very useful for us to make decision for feature engineering.
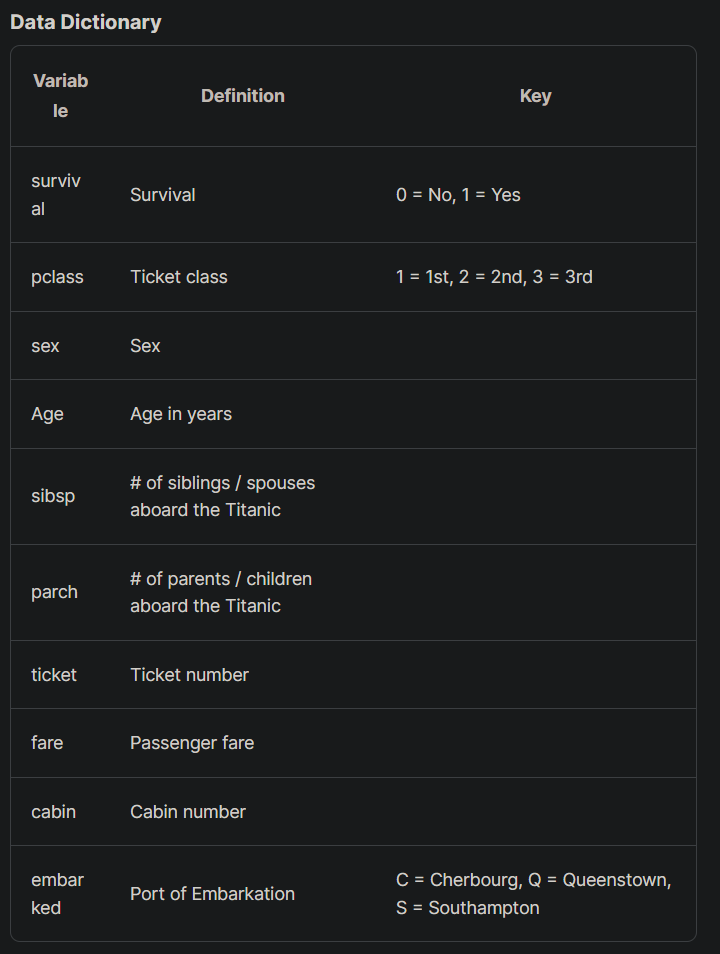
According to the data dictionary, I decided to remove PassengerID, Name, Ticket, Fare and Cabin columns as I think these columns didn't affect the outputs. Of course, you can keep or remove any columns that you want. You can play around with it to come out with the optimal result for the model training.
Drop the unused columns
train_dataset = train_dataset.drop(['PassengerId','Name','Ticket','Fare','Cabin'], axis = 1)
test_dataset = test_dataset.drop(['PassengerId','Name','Ticket','Fare','Cabin'], axis = 1)
Handling the null values
After we removed the unused columns, we need to handle the rows and columns that contain null values.
For "Embarked" column, we need to drop the rows that have null value from the train_dataset since there is not many null values for "Embarked" column, it is safe to just remove the rows involved. Since test_dataset doesn't have null values for "Embarked" column, we no need to include it for the rows dropping.
# drop the rows that embarked column have null values for train_dataset
train_dataset = train_dataset.dropna(subset=['Embarked'], axis = 0)
For "Age" column, since there are many rows involved, instead of removing the rows, we are going to fill it up with the mean values.
#fill up the age values with mean values for both datasets
train_dataset['Age'].fillna(value = round(np.mean(train_dataset['Age'])), inplace = True)
test_dataset['Age'].fillna(value = round(np.mean(test_dataset['Age'])), inplace = True)
Change the categorical columns to numerical columns.
for machine learning model training, the column value need to be in number instead of string. However, there are some columns that are categorical columns. For this case, we need to transform it into numerical columns by mapping the values with the label.
For this case, we need to change the "Sex" and "Embarked" columns.
For "Sex" column,
"male" is mapped to 0
"female" is mapped to 1
train_dataset['Sex'] = train_dataset['Sex'].map({
    'male': 0,
    'female':1
})

test_dataset['Sex'] = test_dataset['Sex'].map({
    'male': 0,
    'female':1
})
For "Embarked" column,
"Cherbourg, C" is mapped to 0,
"Queenstown, Q" is mapped to 1,
"Southampton, S" is mapped to 2
train_dataset['Embarked'] = train_dataset['Embarked'].map({
    'C': 0,
    'Q':1,
    'S':2
})

test_dataset['Embarked'] = test_dataset['Embarked'].map({
    'C': 0,
    'Q':1,
    'S':2
})
Get the "Survived" column as target value
get the Survived column as target value for prediction for both train and test dataset.
train_labels = train_dataset["Survived"]
train_dataset = train_dataset.drop(["Survived"], axis=1)
test_labels = test_labels["Survived"]
Check the information for features and labels for both train and test dataset.
print(test_dataset.info())
print(test_labels.info())
print(train_dataset.info())
print(train_labels.info())
Convert the dataframes to numpy array for both train and test dataset.
test_dataset = test_dataset.values
test_labels = test_labels.values
train_dataset = train_dataset.values
train_labels = train_labels.values
This step is needed because we want to avoid this error 'UserWarning: X does not have valid feature names, but LogisticRegression was fitted with feature names" when we are using streamlit web app for prediction.
Data Normalization
For data normalization, we are going to use StandardScaler. StandardScaler is a preprocessing step in machine learning that scales and standardizes the features of a dataset. It transforms the data to have a mean of 0 and a standard deviation of 1, which makes the data more consistent and easier to work with.
This is especially important when dealing with features that have vastly different ranges or units of measurement, as it ensures that no feature dominates the others. StandardScaler works by subtracting the mean of the feature from each data point and then dividing by the standard deviation.

This results in a transformed dataset that is centered around zero with a standard deviation of 1.
Also, we need to pickle the StandardScaler after we fit the train_dataset so that we can use the same data normalization when we are using streamlit web app for prediction.
import pickle
scaler = StandardScaler()
scaler.fit(train_dataset)
# save the scaler object to a file
with open('scaler.pkl', 'wb') as file:
    pickle.dump(scaler, file)
Now we need to scaler transform the dataset based on the data fitted
train_dataset = scaler.transform(train_dataset)
test_dataset = scaler.transform(test_dataset)
Pickle is a module in Python that allows you to serialize and deserialize Python objects into a file or a byte stream. It's commonly used for storing or transmitting data between different Python programs or versions. The process of serialization involves converting a Python object into a stream of bytes that can be stored or transmitted, while deserialization involves converting the byte stream back into a Python object. Pickle is often used for caching or saving the state of machine learning models or other complex data structures, as it allows you to easily save and load these objects without having to recreate them from scratch each time.
Train the model using Logistic Regression
now we are going to train the model using Logistic Regression. Since it is a classification model, we need to feed it the features, and the target values for this case is survive(1) or not survived(0). For the theory for Logistic Regression, you may read this article. you may read this article.
model = LogisticRegression()
model.fit(train_dataset, train_labels)
Model Validation
After we trained the model, we need to test out the model to make sure it works by using the test dataset and .score method.
test_score =model.score(test_dataset, test_labels)
print(test_score)
We also can print out the coefficients for each feature to see which feature has more influence to the prediction.
# Analyze the coefficients
# Coefficients are the weights of the features
# The higher the coefficient, the higher the importance of the feature
# features are Pclass, Sex, Age, SibSp, Parch, Embarked
print(list(zip(['Pclass','Sex','Age','Sibsp', 'Parch', 'Embarked'],model.coef_[0])))
Save the model
If the model score is good (more than 90%), then this model is good to go.
We need to save and download this trained model by using pickle library.
# save the model using pickle
import pickle
with open('model.pkl', 'wb') as file:
    pickle.dump(model, file)
to make sure the pickled model works, you can call it out and see how the model scores using the test dataset.
pickled_model = pickle.load(open('model.pkl', 'rb'))
test_score =pickled_model.score(test_dataset, test_labels)
print(test_score)
Congratulations, you have built your machine learning model and now we are going to integrate this model into Streamlit app.
Part 3 - Create a Streamlit app
now we are going to perform our last step of the workshop which is creating streamlit app.
Streamlit is a Python library that enables you to create interactive web applications for data science and machine learning projects. It provides an easy-to-use interface for building and deploying data-driven applications, without requiring extensive web development knowledge.
With Streamlit, you can create custom interfaces and visualizations for your data, as well as incorporate user input and data manipulation functionality.
Streamlit also includes built-in support for popular machine learning and data science libraries, making it easy to create and deploy applications that incorporate these tools.
Save your model_training.ipynb and open consume.py
import the necessary libraries
import streamlit as st
import pandas as pd
import pickle
import the pickled model and scaler
pickled_model = pickle.load(open('model.pkl', 'rb'))
pickled_scaler = pickle.load(open('scaler.pkl', 'rb'))
now create the header for the streamlit app
st.title('Does he/she survived from Titantic? :ship:')
st.caption(
    'we gonna using the model we trained just now to predict if the passenger survived or not.')
st.subheader('Fill the form below make prediction.')
in order to see the changes, you need to go to your terminal and run the code below
streamlit run consume.py
after you run the code, it will open http://localhost:8501/ in your browser. If not, you can paste this http://localhost:8501/ in the browser manually to see the website.
It should show something like this.

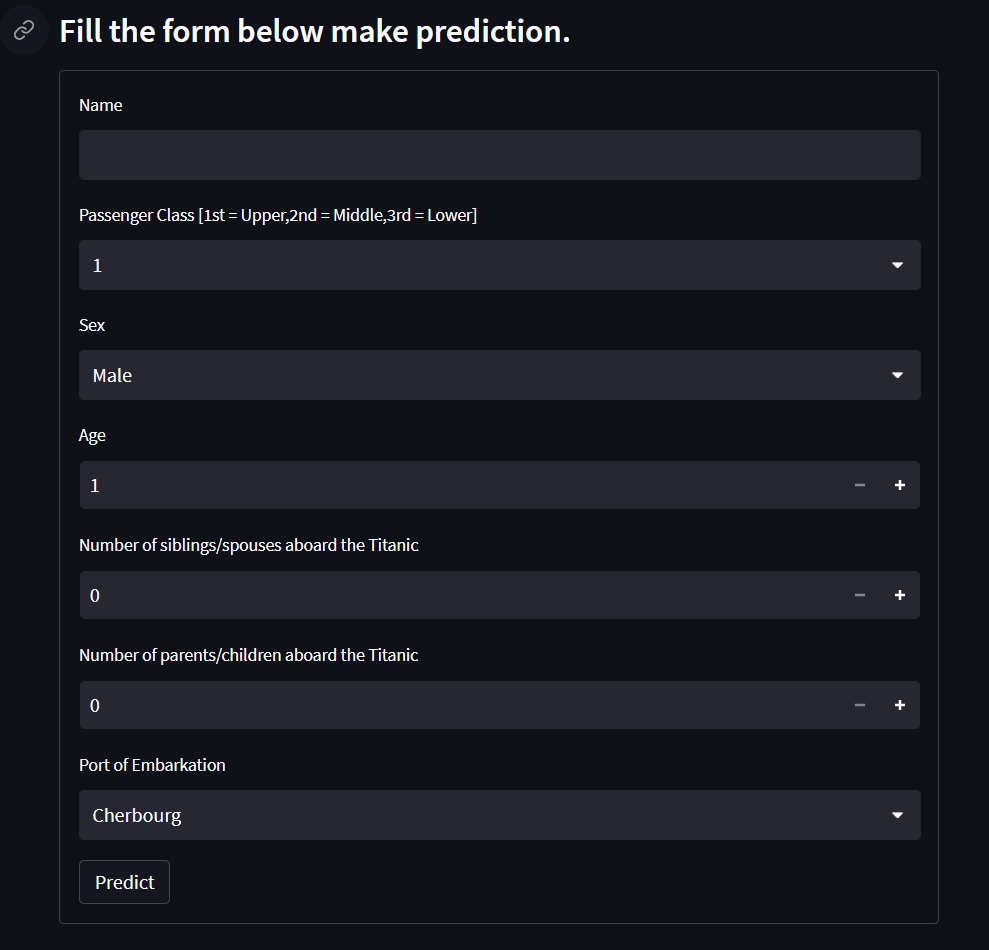
Create a form for user input
Now we are going to create an input form widget for user to input the features value for the titanic prediction.
Streamlit has many built in widgets for us to make interactive website.
References: https://docs.streamlit.io/library/api-reference
form = st.form(key='my-form')
Create the rows according to the features needed for the form.
# Name
Name = form.text_input('Name')
# First feature : Pclass
Pclass = form.selectbox(
    'Passenger Class [1st = Upper,2nd = Middle,3rd = Lower]', options=[1, 2, 3])
# Second feature : Sex
sex = form.selectbox('Sex', options=['Male', 'Female'])
# Third feature : Age
Age = form.number_input('Age', min_value=1, max_value=100, value=1, step=1)
# Fourth feature : number of siblings/spouses aboard the Titanic
SibSp = form.number_input('Number of siblings/spouses aboard the Titanic',
                          min_value=0, max_value=10, value=0, step=1)
# Fifth feature : number of parents/children aboard the Titanic
Parch = form.number_input('Number of parents/children aboard the Titanic',
                          min_value=0, max_value=10, value=0, step=1)
# Sixth feature :
embarked = form.selectbox('Port of Embarkation', options=[
                          'Cherbourg', 'Queenstown', 'Southampton'])
predict = form.form_submit_button('Predict')
The predict variable is to determine that whether the user has submitted the response or not.
It should show something like this.
Make prediction based on user input
If predict variable is true or user submitted the response, we need to normalize the inputted features using pickled scalar , and use the inputted features to make prediction using the pickled model.
if predict:
    # convert sex to 0 and 1
    Sex = 0 if sex == "Male" else 1
    embarked_dict = {"Cherbourg": 0, "Queenstown": 1, "Southampton": 2}
    Embarked = embarked_dict[embarked]
    row = [Pclass, Sex, Age, SibSp, Parch, Embarked]
    columns = ['Pclass', 'Sex', 'Age', 'SibSp', 'Parch', 'Embarked']
    row_df = pd.DataFrame([row], columns=columns)
    # use transform instead of fit_transform
    normalized_row = pickled_scaler.transform(row_df.values)
    prediction = pickled_model.predict(normalized_row)
    st.subheader("Prediction Result")
    if prediction == 0:
        st.error(f'{Name} did not survive', icon="🚨")
    else:
        st.success(f'{Name} survived', icon="✅")
This is how it looks like for the prediction result.
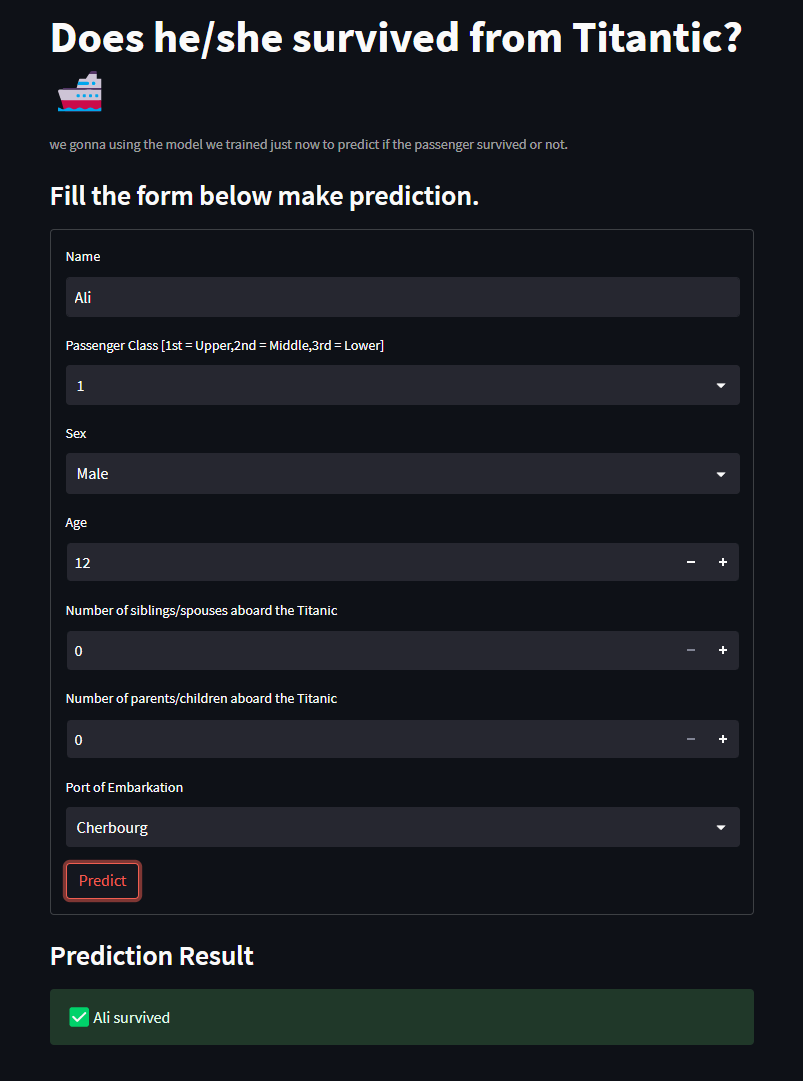
you can make another prediction and see whether it predicts different result or not.
Congratulations, you have created your own titanic survival prediction web app using streamlit.
References
The difference between linear regression and logistic regression linkedin post
Contact
Feel free to contact me if you have any problem:
Shaun.Liew@studentambassadors.com
Shaun Liew Xin Hong
Beta Microsoft Learn Student Ambassador
Universiti Sains Malaysia