

[forwarded from my linkedin article]
Hello, everyone from LinkedIn Network. I'm Shaun Liew Xin Hong, a CS student from Universiti Sains Malaysia. In this post, I would like to share my thoughts about the difference between Linear Regression and Logistic Regression in Machine Learning. Please feel free to correct me if I stated anything wrong as it is just my personal point of view after learning both of them.
Before we go further into the difference between linear regression and logistic regression, we need to know what is Linear regression and Logistic Regression first.
First of all, what is Linear Regression? For me, it is alike to the linear graph that we learned in high school. We use the data/points available to plot the graph of Y(dependant variable) against X(independent variable) and find out the line of best fit. The straight line is drawn in such as way that it passes through as many points as possible. That's all. As simple as this.
Well, please let me explain more about it. A straight line is a rough approximation, but it allows us the ability to explain and predict the variables that have a linear relationship with each other. We can determine the values of certain variables, whether it is x or y from the graph of the line of best fit or from the equation of the line of best fit that is formed.
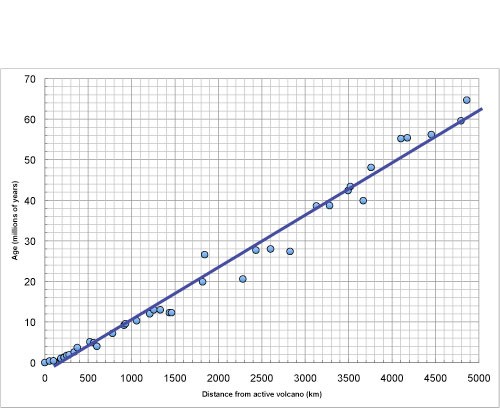
Let us the example from the picture above, we could estimate that the age of the active volcano is 10 million years if we know the distance from an active volcano is 1000 km. The line is explaining the relationship between distance from an active volcano and the volcano age.
Now, let me explain this linear regression more in the machine learning field. Linear regression mainly is used to solve a regression problem such as predicting the GDP of a country, predicting the product price, and so on. Another characteristic of linear regression is its output value is continuous. The range of the output is from negative infinity until positive infinity as long as the data inputs are sufficient. The ultimate goal of a linear regression algorithm is to find the slope and intercept that minimize average loss.
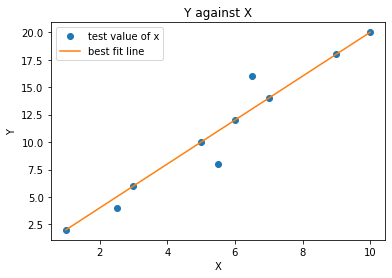
Below is the implementation of Linear Regression in Python using the Scikit learn library and its output.
import matplotlib.pyplot as plt
import pandas as pd
import numpy as np
from sklearn.linear_model import LinearRegression


trained_x = np.array(range(1, 11))
trained_x= trained_x.reshape(-1, 1)


y =np.array([x*2 for x in x])
test_x = np.array([1,2.5,3,5.5,5,6,7,6.5,9,10])
test_x = test_x.reshape(-1, 1)
plt.plot(test_x,y, "o")
line_fitter = LinearRegression()
line_fitter.fit(trained_x,y)
y_predicted = line_fitter.predict(trained_x)
plt.plot(x, y_predicted)
plt.title("Y against X")
plt.xlabel("X")
plt.ylabel("Y")
plt.legend(["test value of x","best fit line"])
plt.show()
I think that's all for the Linear Regression. Now I would like to talk about Logistic Regression which is slightly complicated than Linear Regression.
When an email lands in your inbox, how does your email service know whether it is a real email or spam? Well, we can determine it using Logistic Regression.
Logistic Regression is a supervised machine learning algorithm that uses regression to predict the continuous probability, ranging from 0 to 1, of a data sample belonging to a specific category. The sample can be classified as belonging to the more probable class based on the probability that we obtained. This characteristic definitely makes Logistic Regression a Classification algorithm. This is the BIGGEST difference between Linear Regression and Logistics Regression although both of them contain the word "Regression".
Let us back to the spam email filtering example, a Logistic Regression model would predict the probability of incoming being spam. In the standard condition, if that predicted probability is more than or equal to 0.5, the email is classified as SPAM. We would call SPAM the positive class, with the label of 1, since the positive class is the class our model is looking to detect. If the predicted probability is less than 0.5, the email is classified as a REAL EMAIL( which is the negative class, with the label of 0 in this class). As you can see, the output of the Logistic Regression algorithm has only 2 outputs: true or false / 1 or 0. We would call this act of deciding which of two classes a data sample belongs to binary classification.
Another example of Logistic Regression is disease survival. Will a patient, 5 years after treatment for a disease, still be alive?
Here comes the question. What makes Logistic Regression differ from Linear Regression? Well, before I explain this, let us use Linear Regression to do the classification question and see and you will know why. Below is the graph using the Linear Regression approach to predict the probability of passing an exam based on the study hours.
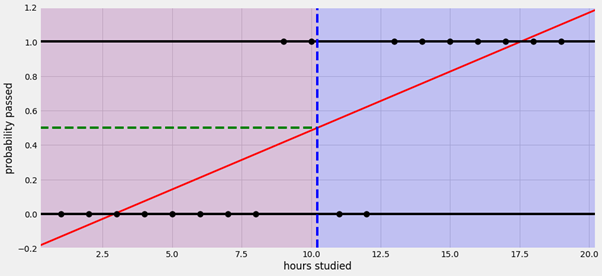
As you can see, the red line is indicating the best fit line and the 2 horizontal lines are indicating the range of probability passed which is from 0 to 1.
A problem quickly arises, when the hours of study are less than 2.5, the regression line predicts NEGATIVE probabilities of passing, and when the hours of study are more than 17.5, the regression line predicts probabilities of passing GREATER THAN 1. These probabilities are definitely RIDICULOUS because as we all know that the range of probability is always between 0 to 1, it wouldn't go beyond this range. The reason why we will get this output is that the output of a Linear Regression model ranges from negative infinity to positive infinity.
How are we gonna solve this problem? The answer will be Sigmoid Function.
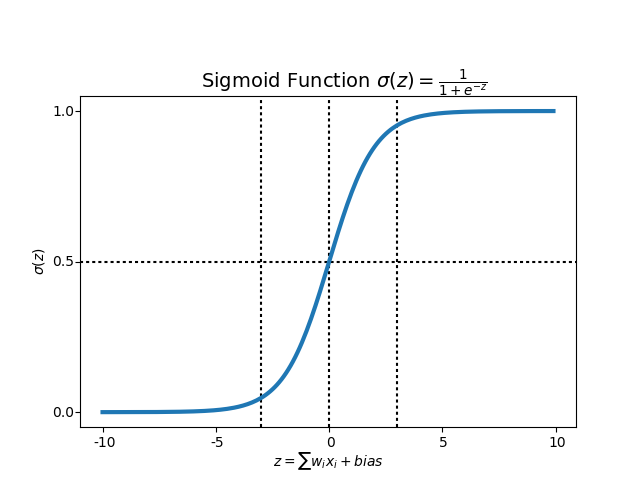
The Sigmoid Function is a special case of the more general Logistic Function, where Logistic Regression gets its name. By plugging the log-odds into the Sigmoid Function, we map the log-odds z to the range [0,1]. In other words, we can ensure that the max value of output is 1 and the min value of output is 0. I wouldn't go further for the word "log-odds" as it is beyond the scope of this post. If you are interested to know more about it, please feel free to contact me.
Below is the implementation of Logistic Regression in Python using the Scikit learn library and its output.
Notes: I'm using the data from Kaggle. Here's the link for the dataset.
https://www.kaggle.com/c/titanic/data?select=train.csv
import pandas as pd

import numpy as np

import matplotlib.pyplot as plt

from sklearn.linear_model import LogisticRegression

from sklearn.model_selection import train_test_split

from sklearn.preprocessing import StandardScaler


# Load the passenger data

passengers = pd.read_csv('passengers.csv')

print(passengers)

# Update sex column to numerical

# change the words male = 0, female = 1

passengers['Sex'] = passengers['Sex'].map({'male':0, 'female': 1})


# Fill the nan values in the age column

print(passengers['Age'].values)

#got nan(null values), need to fill them up with mean value

passengers['Age'].fillna(value = round(np.mean(passengers['Age'])), inplace = True)

print(passengers['Age'].values)


# Create a first class column, add new column called first class that store 1 if the Pclass is 1 else store 0

passengers['FirstClass'] = passengers['Pclass'].apply(lambda x:1 if x==1 else 0)

print(passengers)

# Create a second class column, add new column called second class that store 1 if Pclass is 2 else store 0

passengers['SecondClass'] = passengers['Pclass'].apply(lambda x:1 if x==2 else 0)

print(passengers)


# Select the desired features

features = passengers[['Sex', 'Age', 'FirstClass', 'SecondClass']]

Survival = passengers[['Survived']]

# Perform train, test, split

train_features, test_features, train_labels, test_labels = train_test_split(features, Survival, test_size = 0.2, train_size = 0.8)

# normalize the data

# Scale the feature data so it has mean = 0 and standard deviation = 1

scaler = StandardScaler()

train_features = scaler.fit_transform(train_features)

test_features = scaler.fit_transform(test_features)


# Create and train the model

model = LogisticRegression()

model.fit(train_features, train_labels)


# Score the model on the train data

train_score = model.score(train_features, train_labels)

print(train_score)


# Score the model on the test data

test_score =model.score(test_features, test_labels)

print(test_score)


# Analyze the coefficients

print(model.coef_)

# coef_ answer will be for ['Sex', 'Age', 'FirstClass', 'SecondClass']

#sex plays most important part , second is FirstClass

# Sample passenger features

Jack = np.array([0.0,20.0,0.0,0.0])

Rose = np.array([1.0,17.0,1.0,0.0])

You = np.array([0.0,21.0,0.0,1.0])


# Combine passenger arrays

sample_passengers = np.array([Jack, Rose, You])

# normalised the sample datasets

# Scale the sample passenger features

sample_passengers = scaler.transform(sample_passengers)

#In layman's terms, fit_transform means to do some calculation and then do transformation (say calculating the means of columns from some data and then replacing the missing values). So for training set, you need to both calculate and do transformation.


#But for testing set, Machine learning applies prediction based on what was learned during the training set and so it doesn't need to calculate, it just performs the transformation.


# Make survival predictions!

predicted_result = model.predict(sample_passengers)

print(predicted_result)

predicted_result_probability = model.predict_proba(sample_passengers)

print(predicted_result_probability) # get the probability for u die
 or survived
It might look complicated but let us just focus on few important features.
First, the key features that we used to determine the survival predictions are 'Sex', 'Age', 'FirstClass' and 'SecondClass". We can see the weightage of each factor by using the model.coef_ and here is the output.
[[ 1.28163173 -0.49106542 1.00147939 0.4616232 ]]
The order of this array is Sex, Age, First Class, and Second Class. We can ignore the negative sign and focus on the numeric value. According to the numeric value, we know that Sex plays the most important role.
After keying in some data for the passengers, we can predict whether the passengers can survive the titanic sinking or not.
Jack = np.array([0.0,20.0,0.0,0.0])


Rose = np.array([1.0,17.0,1.0,0.0])
You = np.array([0.0,21.0,0.0,1.0])
The result is as shown below.
[0 1 0]
As I mentioned below, the output of Logistic Regression is either 0 or 1 only. In this case, 0 means the passenger can't survive and 1 means the passenger can survive. Apparently, the second passenger is the only survivor among the 3 of them.
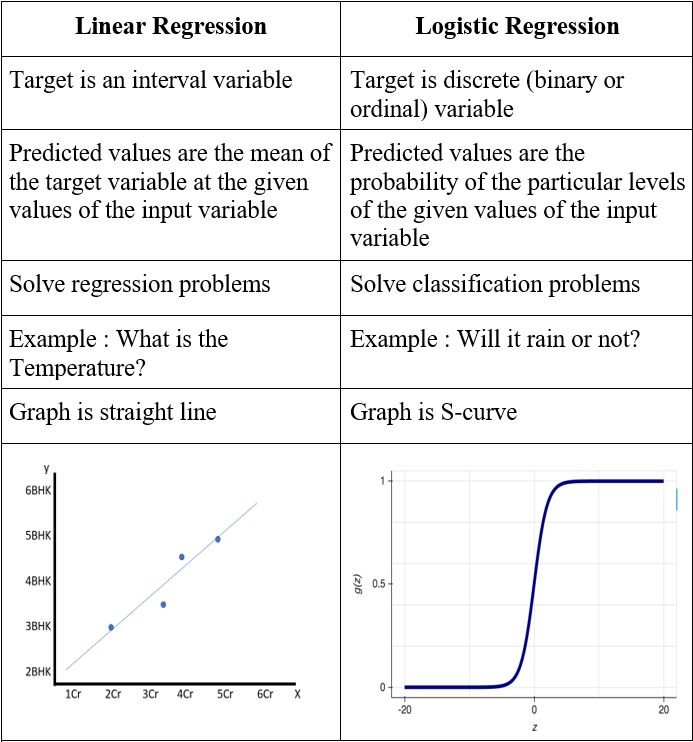
That's my thoughts about the difference between Linear Regression and Logistic Regression in Machine Learning. To end this post, I will show a summary of the difference between these two algorithms. Thank you for reading this post.